Seoul Temperature Prediction: Kaggle Notebook
Hey Everyone,
In today’s blog, we will work on a Kaggle notebook that focuses on analyzing temperature variations, creating models to predict minimum and maximum Temperature, and Finally deploying the best model on TrueFoundry.
So, Let’s get started.

Introduction
Today we are going to work on the Seoul Temperature dataset. Seoul is a city in South Korea (yes you’re right, BTS live there).
Firstly we will start with exploratory data analysis, then we will do some Plotly Visualisations, after which we will train a few models from LuciferML and finally do the deployment on TrueFoundry.
For those who don’t know
LuciferML is an AutoML Library for Creating models. It takes away all your hassles and does your hard work. It’s currently in development — it Preprocesses and Trains different models on your Data.
TrueFoundry is an MLOps platform that provides the fastest post-model pipeline framework for Data Scientists (DS) and Machine Learning Engineers (MLEs). It also allows for the monitoring of the trained model in 15 minutes. With MLFoundry, you can track experiments with a few lines of Code, compare and visualize experiments on a rich dashboard, and log experiment artifacts.
About Dataset
The Seoul Temperature dataset from Kaggle has 25 columns, out of which we have to predict the “Next_Tmin and Next_Tmax” column.
It has data that tells based on the different atmospheric values how the Min/Max Temperature gets affected
Installation
!pip install lucifer-ml mlfoundry servicefoundry gradioImporting Libraries
import matplotlib.pyplot as plt
plt.style.use('fivethirtyeight')
plt.style.use('dark_background')
import numpy as np
import pandas as pd
import seaborn as sns
#Importing LuciferML
from luciferml.supervised.classification import Classificationimport mlfoundry as mlf
import warnings
import servicefoundry.core as sfy
warnings.simplefilter(action='ignore', category=Warning)
Loading Dataset
dataset = pd.read_csv('../input/temperature-forecast-project-using-ml/temp.csv')Exploratory Data Analysis

There are a few missing values in the dataset there we will drop them.
Visualizations


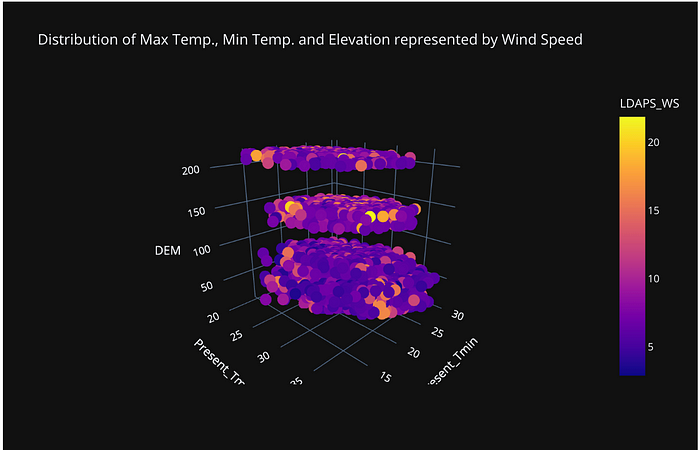
Findings
- Generally higher values of Solar Radiation are Associated with Lower Values of Maximum Temperature
- Higher values of Solar Radiation are associated with lower values of minimum temperature
- Lower values of wind speeds are associated with high temperatures
- Most of the temperature recordings are from Days when Elevation Values are low
Data Preparation
Here, we will create two labels, one for Min Temperature and the other for Max Temp.
features = dataset.drop(['index', 'Date', 'Next_Tmax', 'Next_Tmin'], axis = 1)
labels_max = dataset['Next_Tmax']
labels_min = dataset['Next_Tmin']
Training a lot of Models…
I have trained almost all the models of LuciferML for both Min and Max Temp and have created a list of the scores along with the scores
params_cat ={}

regressor_cat_max = Regression(predictor = 'cat',params= params_cat)
regressor_cat_min = Regression(predictor = 'cat',params= params_cat)# For Max Temp
regressor_cat_max.fit(features, labels_max)
result = regressor_cat_max.result()
accuracy_scores_max[result['Regressor']] = result['Accuracy']
RMSE_max[result['Regressor']] = result['RMSE']
# For Min Temp
regressor_cat_min.fit(features, labels_min)
result = regressor_cat_min.result()
accuracy_scores_min[result['Regressor']] = result['Accuracy']
RMSE_min[result['Regressor']] = result['RMSE']
Leaderboard


From the above plots, we can conclude Catboost Regressor performed well for both Min and Max Temp. Therefore, we will deploy it on TrueFoundry
Deployments
Experiment Tracking is the process of saving/logging all the info. released every experiment and test
a) Login to TrueFoundry
sfy.login(api_key)You can get the API Key from here:
b) Creating a new project
mlf_api = mlfoundry.get_client()
mlf_run = mlf_api.create_run(
    project_name='temp-predictor', run_name='temp-predictor-run-1')
c) Logging Dataset
mlf_run.log_dataset("features", features)
mlf_run.log_dataset("labels_max", labels_max)
mlf_run.log_dataset("labels_min", labels_min)
d) Logging Models
mlf_run.log_model(name = 'Best_Model_Max', model = regressor_cat_max.regressor, framework = mlfoundry.ModelFramework.SKLEARN, description = 'Temp_pred_max_best')
mlf_run.log_model(name = 'Best_Model_Min', model = regressor_cat_min.regressor, framework = mlfoundry.ModelFramework.SKLEARN, description = 'Temp_pred_min_best')
Deploying model in 3..2..1…
We will deploy our model as a Gradio WebApp.
For deploying a model, we need two files one is deploy.py, which is the deployment code, and requirements.txt.
Directory Structure
.
├── deploy.py
└── requirements.txt
First, we will write deployment code using the magic function
Next, we will gather the requirements
requirements = sfy.gather_requirements("deploy.py")
Creating service and deploying it on our workspace
Here, in resource, we are going to add a Memory Limit of 1GB for our model.
service = Service(
    name="temp-pred-service-1",
    image=Build(
        build_spec=PythonBuild(
            command="python deploy.py",
        ),
    ),
    ports=[{"port": 8080}],
    resources=Resources(memory_limit=1500, memory_request=1000),
)
service.deploy(workspace_fqn='<your-workspace-fqn>')


Deployed Model

Model Deployed Here: https://temp-pred-service-1-demo-projects.tfy-ctl-euwe1-production.production.truefoundry.com/
Video:
Code:
The above Code is also present in this Kaggle Notebook
References:
- TrueFoundry: https://truefoundry.com/
- TrueFoundry App: https://app.truefoundry.com/
- TrueFoundry Docs: http://docs.truefoundry.com/
- Kaggle Notebook: https://www.kaggle.com/code/d4rklucif3r/seoul-temp-pred-deployments-luciferml-95?scriptVersionId=110190571